Energy for the Earth
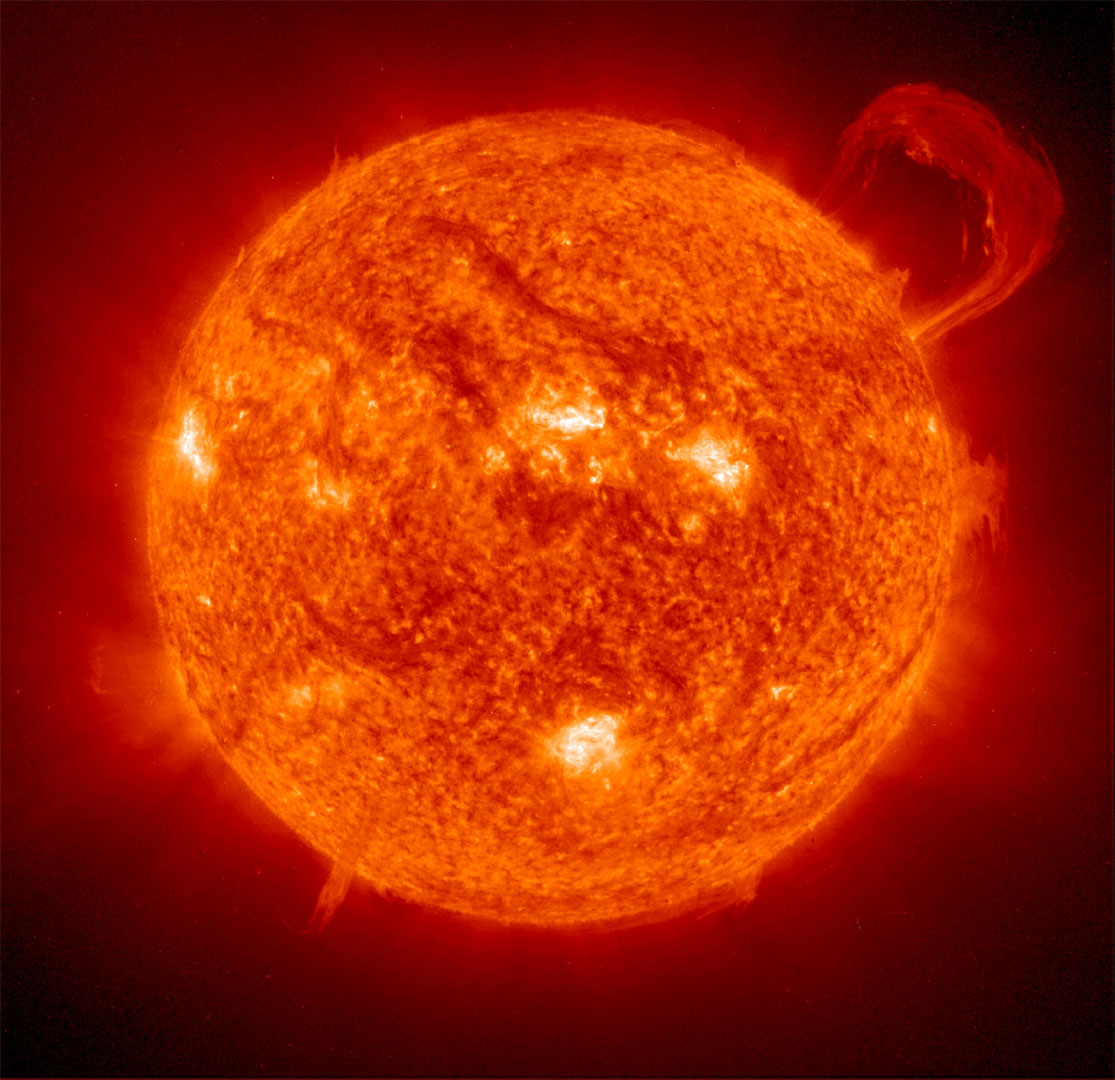 Energy from the sun is primarily responsible for the heating of the Earth.
In order to account for temperature changes over the course of the year (and for the reversal of seasons in the northern and southern hemispheres), attention must first be paid to how the Earth receives its energy from the sun.
The view to the right in the main view panel shows the amount of solar energy that reached the Earth’s surface during December 2010. The amount of solar energy (i.e. radiation) reaching the Earth’s surface is also known as insolation.
- Carefully examine the colors for the insolation data.
- What color corresponds to the greatest amount of solar insolation, and what color corresponds to the least amount? Pinkish-white corresponds to the greatest amount of solar insolation. Dark blue corresponds to the least amount.
(Note on insolation units: The value 100 W/m2 corresponds to the equivalent energy of a 100 Watt light bulb being completely concentrated in a 1 m2 (1.2 yd2) area.)
- Click here to see a Mercator projection in order to get a better global overview of the insolation data for December 2010.
- Compare the amount of insolation that each hemisphere received during December 2010. The amount of insolation that the northern hemisphere receives during December is far less than that received in the southern hemisphere.
- Does the insolation distribution correspond to the type of season in each hemisphere? Explain. Yes, the insolation distribution corresponds to the type of season in each hemisphere. The northern hemisphere receives very little insolation in December. This results in low temperatures, and, therefore, corresponds to winter. The southern hemisphere, on the other hand, receives a great deal of solar insolation in December. This results in higher temperatures that correspond to summer in the southern hemisphere.
- Predict how the insolation data will change for June 2010. The pattern of the insolation data should reverse. The northern hemisphere should now have increased insolation (i.e. summer) while the southern hemisphere should have decreased insolation (i.e. winter).
- Click here to now see the insolation data for June 2010.
- Does this new data support your prediction in question 4? Yes, the new data for June 2010 shows a reversal in the amounts of insolation in the northern and southern hemispheres.
- Click here to see a video illustrating monthly changes in insolation in 1994.
The sun emits equal amounts of energy in all directions. The insolation data, therefore, poses an interesting problem. Why does the amount of insolation vary with latitude, and why does it also vary over the course of the year resulting in seasons? These questions will be addressed in the next section.
Insolation: This word dates from 1617 and is formed from the Latin word insolare which means to expose to the Sun.
Energy Loss
Only about one-half of the incoming energy from the sun makes it through the atmosphere and is absorbed by the Earth’s surface.